
The glycemic index (or GI) is a ranking of carbohydrates on a scale from 0 to 100 according to the extent to which they raise blood sugar (glucose) levels after eating. Foods with a high GI are those which are rapidly digested, absorbed and metabolised (blood sugar spikes). Low GI carbohydrates produce smaller fluctuations in your blood glucose and insulin levels. Choosing low GI foods will improve your long-term health and reduce your risk of type 2 diabetes and heart disease. It is also one of the keys to maintaining weight loss because constant glucose (and insulin) spikes are very bad. When blood glucose goes up, insulin is triggered. So the insulin level in your body will fluctuate according to what you eat. The main problem with the Glycemic Index is that it does not factor in typical portion sizes., nor does it look at the proportion of carbs in the food.
 The concept of GI was initially developed to help diabetes patients. It’s important for diabetics and pre-diabetics to pay close attention to their blood glucose fluctuations and insulin levels. However, everyone can all benefit from paying attention to the types of carbohydrates we eat. Whether we eat a snickers bar or a strawberry, both will be converted into glucose. What will be different, though, is how quickly this fuel enters the bloodstream.
Glycemic Load (GL)
Some carbs metabolise very quickly (such as watermelon with a GI of 72) but contain very few carbs. The watermelon only has about 5g of carbohydrate in a big slice, so is has a very low glycemic load. You would need to eat a lot to have a big impact on glucose levels. A food’s glycemic load is calculated directly from its glycemic index. We simply take the food’s GI, divide it by 100, and multiply it by the grams of carbohydrate (excluding fiber) in a typical serving size. A GL of above 20 is considered high, the 11-19 range is considered average, and below 11 is low.

Mother nature never intended these frequent spikes. Too much insulin is floating around for too long a period, your bodies never has a rest. There are 2 great ways to reduce this spiking:
- Eating low GI/GL foods.
- Intermittent fasting. This is not dieting, it simply focuses upon WHEN you eat. You typically do 16 hours of fasting (this includes sleeping!) and 8 hours of eating whatever you want. You don't count calories. As you can see from the diagram below, the spiking of insulin is squashed within an 8 hours period, giving your endocrine system a well deserved rest! Read more about intermittent fasting.

What foods have low a low GI?
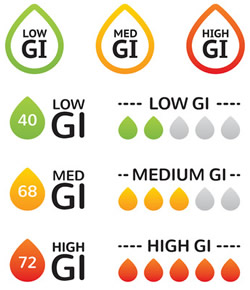
The GI is indicative of how quickly your blood sugar levels will rise after a carbohydrate food is eaten. The higher the number, the more that food will spike your blood sugar. The glycemic index does not take into account the amount of carbohydrates in each serving. This is where the glycemic load value comes into play, because some foods have carbohydrate percentages. Glucose = 100.
| FOOD | Glycemic index | Serving size (grams) | Glycemic load per serving |
| BAKERY PRODUCTS AND BREADS | |||
| Banana cake, made with sugar | 47 | 60 | 14 |
| Banana cake, made without sugar | 55 | 60 | 12 |
| Sponge cake, plain | 46 | 63 | 17 |
| Vanilla cake made from packet mix with vanilla frosting (Betty Crocker) | 42 | 111 | 24 |
| Apple muffin, made with rolled oats and sugar | 44 | 60 | 13 |
| Apple muffin, made with rolled oats and without sugar | 48 | 60 | 9 |
| Waffles, Aunt Jemima® | 76 | 35 | 10 |
| Bagel, white, frozen | 72 | 70 | 25 |
| Baguette, white, plain | 95 | 30 | 14 |
| Coarse barley bread, 80% kernels | 34 | 30 | 7 |
| Hamburger bun | 61 | 30 | 9 |
| Kaiser roll | 73 | 30 | 12 |
| Pumpernickel bread | 56 | 30 | 7 |
| 50% cracked wheat kernel bread | 58 | 30 | 12 |
| White wheat flour bread, average | 75 | 30 | 11 |
| Wonder® bread, average | 73 | 30 | 10 |
| Whole wheat bread, average | 69 | 30 | 9 |
| 100% Whole Grain® bread (Natural Ovens) | 51 | 30 | 7 |
| Pita bread, white | 68 | 30 | 10 |
| Corn tortilla | 52 | 50 | 12 |
| Wheat tortilla | 30 | 50 | 8 |
| BEVERAGES | |||
| Coca Cola® (US formula) | 63 | 250 mL | 16 |
| Fanta®, orange soft drink | 68 | 250 mL | 23 |
| Lucozade®, original (sparkling glucose drink) | 95 | 250 mL | 40 |
| Apple juice, unsweetened | 41 | 250 mL | 12 |
| Cranberry juice cocktail (Ocean Spray®) | 68 | 250 mL | 24 |
| Gatorade, orange flavor (US formula) | 89 | 250 mL | 13 |
| Orange juice, unsweetened, average | 50 | 250 mL | 12 |
| Tomato juice, canned, no sugar added | 38 | 250 mL | 4 |
| BREAKFAST CEREALS AND RELATED PRODUCTS | |||
| All-Bran®, average | 44 | 30 | 9 |
| Coco Pops®, average | 77 | 30 | 20 |
| Cornflakes®, average | 81 | 30 | 20 |
| Cream of Wheat® | 66 | 250 | 17 |
| Cream of Wheat®, Instant | 74 | 250 | 22 |
| Grape-Nuts® | 75 | 30 | 16 |
| Muesli, average | 56 | 30 | 10 |
| Oatmeal, average | 55 | 250 | 13 |
| Instant oatmeal, average | 79 | 250 | 21 |
| Puffed wheat cereal | 80 | 30 | 17 |
| Raisin Bran® | 61 | 30 | 12 |
| Special K® (US formula) | 69 | 30 | 14 |
| GRAINS | |||
| Pearled barley, average | 25 | 150 | 11 |
| Sweet corn on the cob | 48 | 60 | 14 |
| Couscous | 65 | 150 | 9 |
| Quinoa | 53 | 150 | 13 |
| White rice, boiled, type non-specified | 72 | 150 | 29 |
| Quick cooking white basmati | 63 | 150 | 26 |
| Brown rice, steamed | 50 | 150 | 16 |
| Parboiled Converted white rice (Uncle Ben's®) | 38 | 150 | 14 |
| Whole wheat kernels, average | 45 | 50 | 15 |
| Bulgur, average | 47 | 150 | 12 |
| COOKIES AND CRACKERS | |||
| Graham crackers | 74 | 25 | 13 |
| Vanilla wafers | 77 | 25 | 14 |
| Shortbread | 64 | 25 | 10 |
| Rice cakes, average | 82 | 25 | 17 |
| Rye crisps, average | 64 | 25 | 11 |
| Soda crackers | 74 | 25 | 12 |
| DAIRY PRODUCTS AND ALTERNATIVES | |||
| Ice cream, regular, average | 62 | 50 | 8 |
| Ice cream, premium (Sara Lee®) | 38 | 50 | 3 |
| Milk, full-fat, average | 31 | 250 mL | 4 |
| Milk, skim, average | 31 | 250 mL | 4 |
| Reduced-fat yogurt with fruit, average | 33 | 200 | 11 |
| FRUITS | |||
| Apple, average | 36 | 120 | 5 |
| Banana, raw, average | 48 | 120 | 11 |
| Dates, dried, average | 42 | 60 | 18 |
| Grapefruit | 25 | 120 | 3 |
| Grapes, black | 59 | 120 | 11 |
| Oranges, raw, average | 45 | 120 | 5 |
| Peach, average | 42 | 120 | 5 |
| Peach, canned in light syrup | 52 | 120 | 9 |
| Pear, raw, average | 38 | 120 | 4 |
| Pear, canned in pear juice | 44 | 120 | 5 |
| Prunes, pitted | 29 | 60 | 10 |
| Raisins | 64 | 60 | 28 |
| Watermelon | 72 | 120 | 4 |
| BEANS AND NUTS | |||
| Baked beans | 40 | 150 | 6 |
| Black-eyed peas | 50 | 150 | 15 |
| Black beans | 30 | 150 | 7 |
| Chickpeas | 10 | 150 | 3 |
| Chickpeas, canned in brine | 42 | 150 | 9 |
| Navy beans, average | 39 | 150 | 12 |
| Kidney beans, average | 34 | 150 | 9 |
| Lentils | 28 | 150 | 5 |
| Soy beans, average | 15 | 150 | 1 |
| Cashews, salted | 22 | 50 | 3 |
| Peanuts | 13 | 50 | 1 |
| PASTA and NOODLES | |||
| Fettucini | 32 | 180 | 15 |
| Macaroni, average | 50 | 180 | 24 |
| Macaroni and Cheese (Kraft®) | 64 | 180 | 33 |
| Spaghetti, white, boiled, average | 46 | 180 | 22 |
| Spaghetti, white, boiled 20 min | 58 | 180 | 26 |
| Spaghetti, whole-grain, boiled | 42 | 180 | 17 |
| SNACK FOODS | |||
| Corn chips, plain, salted | 42 | 50 | 11 |
| Fruit Roll-Ups® | 99 | 30 | 24 |
| M & M's®, peanut | 33 | 30 | 6 |
| Microwave popcorn, plain, average | 65 | 20 | 7 |
| Potato chips, average | 56 | 50 | 12 |
| Pretzels, oven-baked | 83 | 30 | 16 |
| Snickers Bar®, average | 51 | 60 | 18 |
| VEGETABLES | |||
| Green peas | 54 | 80 | 4 |
| Carrots, average | 39 | 80 | 2 |
| Parsnips | 52 | 80 | 4 |
| Baked russet potato | 111 | 150 | 33 |
| Boiled white potato, average | 82 | 150 | 21 |
| Instant mashed potato, average | 87 | 150 | 17 |
| Sweet potato, average | 70 | 150 | 22 |
| Yam, average | 54 | 150 | 20 |
| MISCELLANEOUS | |||
| Hummus (chickpea salad dip) | 6 | 30 | 0 |
| Chicken nuggets, frozen, reheated in microwave oven 5 min | 46 | 100 | 7 |
| Pizza, plain baked dough, served with parmesan cheese and tomato sauce | 80 | 100 | 22 |
| Pizza, Super Supreme (Pizza Hut®) | 36 | 100 | 9 |
| Honey, average | 61 | 25 | 12 |
Beers tend to not have a huge insulin response because they are typically quite low in carbs in relation to volume. However they contain alcohol which need to be processed by the liver. So the GI index for beers doesn't really apply. Some sweet cocktails and spirits with mixers (such as coke or sprite) have a big GI thanks to the high sugar content.
